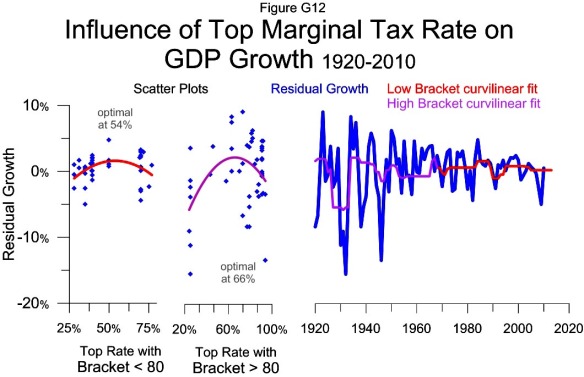
 The two scatter plots show the curvilinear relationship between the top rate and residual growth for the data when the top bracket was above and below 80 times per-capita GDP. The charts use the same two year lead time as previous charts showing the relationship between the top rate and growth.
The red curvilinear fit line from the left scatter plot is the basis for the growth estimate shown in red on the time-series plot. The violet curvilinear fit line in the right scatter plot is the basis for the growth estimate shown in violet on the time-series plot.
The violet and red lines together show the influence of the top marginal tax rate on growth for the last 90 years. This influence combined with the influence of the top bracket and capital gains rate make the model in Figure G14.
The residual growth is the actual growth less the influence of the top bracket; its construction is shown in Figure G11. The fastest year of residual growth was 1923 which grew 9% faster than the estimate based on the top bracket. This year corresponds to the 73% top rate in 1921.
Having the top rate estimate residual growth makes for a more natural combination of the two data ranges with different brackets. The different ranges for the top bracket are shown in Figure T3.
