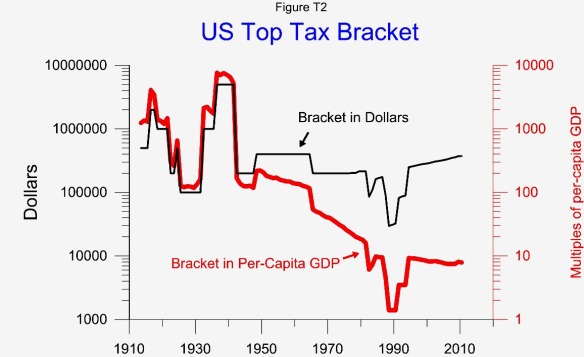
T2 Top Tax Bracket 1913-2010

The top tax bracket is the income level above which the top marginal tax rate applies. In 2010 the top bracket for married filing jointly couples was $373,650. The portion of ordinary family income above this level was taxed at the top rate of 35%. The first $373,650 of family income was taxed at the lower marginal rates.

The top bracket has ranged from $29,000 to $5 million or from 1.4 times per-capita GDP to 7648 times. Currently the bracket is about 7.9 times per-capita GDP. The top bracket as a multiple of per-capita GDP has a stronger correlation with growth and job creation than as a dollar amount or an inflation adjusted dollar amount.

The top bracket to some degree represents the scope and progressivity of the tax system. When it was at $5 million it directly affected very few people, but represented a system with over 30 tax brackets.

The top bracket has its strongest positive correlation to GDP growth leading 3 years. So a higher bracket this year would be a positive influence on GDP growth 3 years from now. The correlation is shown in Figures G9 and G10.

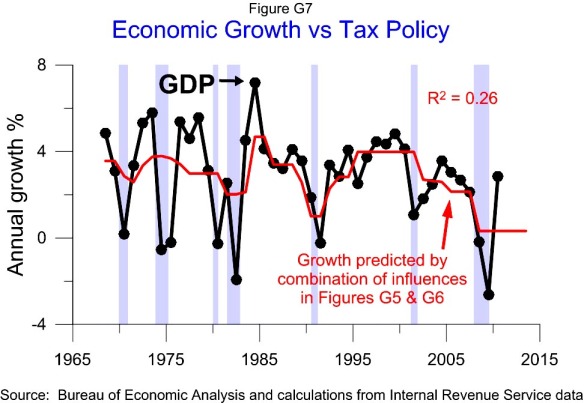
G7 Tax Policy vs GDP Growth 1968-2010

Figure G7 shows annual growth for GDP from 1968 to 2010 and the combined influence on growth from the curvilinear relationship of the top marginal tax rate on growth shown in Figure G5 and the curvilinear relationship of the capital gains tax rate shown in Figure G6.

The curvilinear relationships of the tax rates with growth suggest the baseline growth rate for current tax policy is 0.3%.  This is weaker than the forecast of the linear correlations shown in Figure G3.

Figure G8 shows the actual growth over 5 year periods and the 5 year rate of growth estimated by the above model.

To show the influence of tax policy on growth prior to 1968 requires showing the influence of the top tax bracket on growth and how the top bracket affects the growth optimizing tax rates. These correlations are covered in Figures T2, T3 and G9 –G15.

G5 Top Marginal Rate vs GDP Growth 1968-2010

This figure shows the curvilinear relationship between economic growth from 1968 to 2010 and the top marginal tax rate. Each point in the scatter plot shows the growth rate for one year with the top tax rate from two years earlier. For example the highest point on the chart show that GDP grew 7.2% in 1984 and that the top tax rate two years earlier in 1982 was 50%.

The best fit curved red line in the scatter plot is used to make the model in the time series plot on the right. The data suggests that a top tax rate of about 54% would maximize the growth rate and if the tax rate is above or below that level that growth will be weaker two years later.

The influence of the top tax rate on growth is combined with the effect of the capital gains tax rate in Figure G6 to make a model that estimates growth in Figure G7.

G2 GDP Growth with low tax rates 1920-2010

The green triangles show the years of growth influenced by a top marginal tax rate below 37%. The top rate one year influences growth about two years later. So when the top rate was cut to 35% in 2003 it affected growth beginning about 2005. The years affected by at this low top rate averaged a negative growth rate of -0.1%.

The blue diamonds show the years influenced by a capital gain tax rate at or below 20%. The capital gains rate leads growth by about 5 years. So cutting the capital gains rate to 20% in 1997 began affecting growth about 2002. The years corresponding to a capital gain rate at or below 20% averaged growing at 1.4%.

The years affected by both a top rate below 37% and a capital gains rate at or below 20% averaged negative growth at -0.8%. The Great Depression, the recession of 1990 and the Great Recession were all influenced by such a tax policy. Only one year affected by such a tax policy, 1929, had above average growth.

Growth influenced by low tax rates compares poorly with the 3.3% average growth rate.