June’s ten year anniversary of President Bush’s first tax cut invites pondering the results of tax cuts. Data in the last two decades suggest they worked for politicians at the expense of workers and economic growth.
The 2004 election gave tax cutting Republicans their strongest control of Washington since the 1920s. President Obama’s middle class tax cuts reduced Federal revenue to about 16 percent of GDP. He’s on track to be the lowest tax President since the 1940s. Conversely, George H. W. Bush raised taxes in 1991 (legislated in 1990), preceding defeat in 1992. A Democratic Congress raised them in 1993 and lost in 1994. No one has raised Federal income tax rates since.
Tax policy has stark consequences. The 23 million new jobs created between 1991 and 2000 correlate with tax increases in 1991, 1993 and the lagged effect of a capital gains increase in 1987 (legislated in 1986). This tax increase decade turned record budget deficits to record surpluses and the stock market tripled after dividends and inflation. GDP grew twice as fast as the decade 2001-2010 with the influence of tax cuts in 2001, 2003 and the lagged effect of a capital gain cut in 1997. The tax cut decade lost two million jobs, ended with record budget deficits and the stock market shed a tenth of its real value.
Tax cuts were sold as “job creating,” but reduced the tax advantage to business owners from deducting employee wages. When the top tax rate and the capital gains rate are too low, the wealthy pull equity out of businesses as personal income which leaves less money to grow the economy. The same thing happened in The Great Depression where a top rate of 25 percent and a capital gains rate of 12.5 percent led to a 25 percent unemployment rate.
The money businesses spend growing the economy on wages, equipment, marketing, research and development is all deducted. The income tax only applies to money not spent growing the economy. Paul Ryan’s proposed tax cuts cannot leave more money in businesses to grow the economy and like Bush’s cuts would inspire owners and executives to leave less.
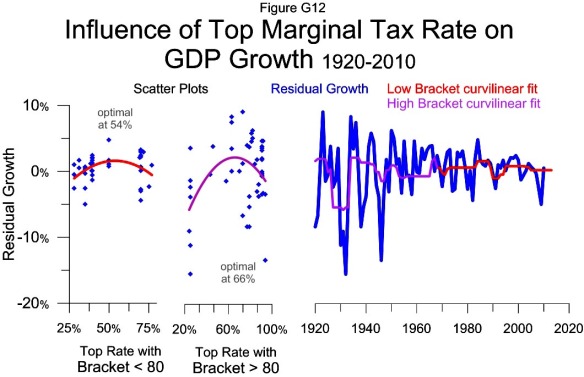
A low average tax rate is necessary for workers to have incentive to work and for the wealthy to fund and run businesses, but a high marginal rate encourages putting or leaving the marginal dollar in a business where it is deducted and promotes growth.
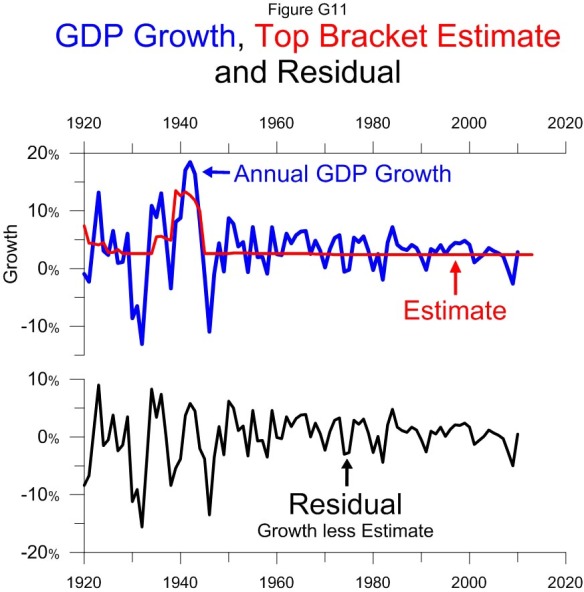
If marginal tax rates are too low or high or if tax brackets are too low, growth falters with a lag. The top rate influences growth about two years later (see chart). The top bracket affects growth about three years later (see chart) and the capital gains rate about five years later (see chart).
High tax brackets allow a low average tax rate with high marginal rates. The strongest growth came with the highest bracket of $5 million. Adjusted for inflation the $5 million would be about $78 million today. Adjusted for GDP per-person it would be about $355 million.
A 70 percent tax rate on the portion of income above $355 million would leave plenty of incentive for the very talented, like Warren Buffet, Bill Gates or Mark Zuckerberg, to run a business. It would also give strong incentive to plow any potential income over $355 million into a business where the value could grow tax free for years or decades. Eventually, the gain would be taxed as capital gain or in estate taxes, if not given to charity. In the meantime, it would create jobs.
In the tax cut decade the wealthy paid more tax and a bigger share of it. Raising tax rates and brackets could shift incentives so the wealthy take less income, pay less tax and grow the economy and their long term wealth more.


