E2 Unemployment vs Capital Gains

The capital gains tax rate has a curvilinear relationship with the unemployment rate. The strongest correlation is with the capital gains rate leading by 6 years. The capital gains rate that minimizes unemployment appears to be about 24.7%, but any rate between 21% and 29% would help keep the unemployment rate low.

The capital gains tax rate was raised to 39.9% in 1976 six years later the unemployment rate averaged 9.5% in 1982. The capital gains tax rate was cut to 15% in 2003 six year later unemployment averaged 9.3% in 2009. The correlation suggests that a 15% capital gains tax rate is consistent with a 9.1% unemployment rate.

While the current measure of unemployment only goes back to 1948, the correlation suggests that the 12.5% capital gains tax rate in place from 1922 to 1933 would have led to a 12.6% unemployment rate from 1928 through 1939.

The influence of the capital gains tax rate is combined with the influence of the top bracket in Figure E3 to make the unemployment model in Figure E4.

G14 Tax Policy vs GDP Growth 1920-2010

Here is the annual GDP growth rate since 1920 in black. The red line shows a three factor regression model. This tax policy model includes the influences of the top bracket from Figure G9, the top marginal rate from Figure G12 and the capital gains tax rate from Figure G13.

The model accounts for the linear correlation of the top bracket, the curvilinear correlations of the two tax rates and how the curvilinear correlations change as the top bracket rises. This model estimates that the current baseline growth rate for the economy is 1.1%.

The annual growth fluctuates much more than the growth predicted by tax policy. Many of the other factors affecting annual growth may have little effect on the long term trend. Looking at the growth rate over 5 year periods as shown in Figure G15 may show more clearly the impact of tax policy on long term growth.

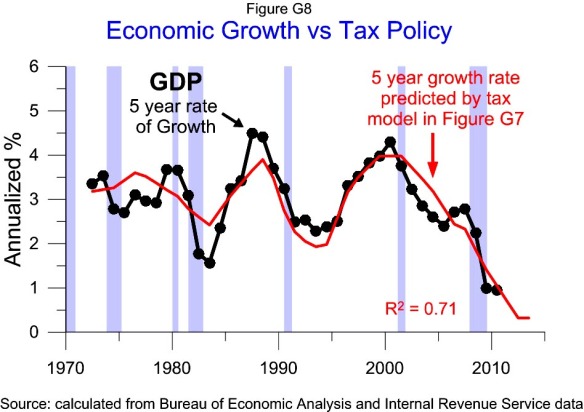
G8 Tax Policy vs Long Term Growth 1968-2010

Here are the 5 year estimates of growth based on the model in Figure G7. The five years 2008-2012 is estimated to annualize growing 0.3% a year, down from the 0.9% annualized for 2006-2010. To hit the 0.3% forecast precisely, 2011 and 2012 would need to grow at a 0.8% rate.

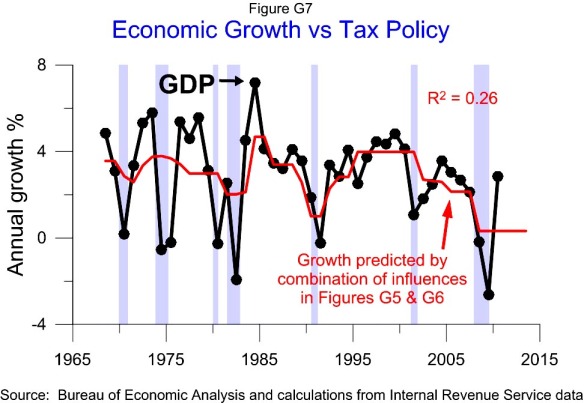
G7 Tax Policy vs GDP Growth 1968-2010

Figure G7 shows annual growth for GDP from 1968 to 2010 and the combined influence on growth from the curvilinear relationship of the top marginal tax rate on growth shown in Figure G5 and the curvilinear relationship of the capital gains tax rate shown in Figure G6.

The curvilinear relationships of the tax rates with growth suggest the baseline growth rate for current tax policy is 0.3%.  This is weaker than the forecast of the linear correlations shown in Figure G3.

Figure G8 shows the actual growth over 5 year periods and the 5 year rate of growth estimated by the above model.

To show the influence of tax policy on growth prior to 1968 requires showing the influence of the top tax bracket on growth and how the top bracket affects the growth optimizing tax rates. These correlations are covered in Figures T2, T3 and G9 –G15.