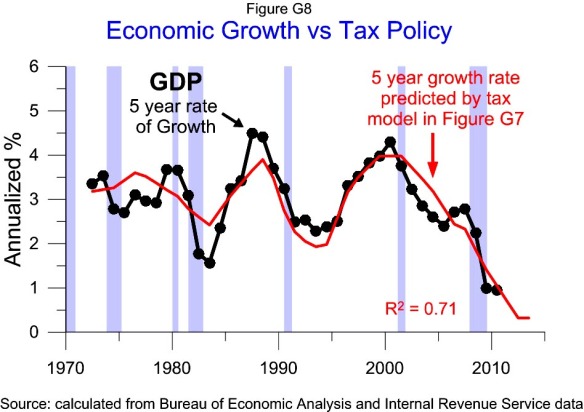
 Here are the 5 year estimates of growth based on the model in Figure G7. The five years 2008-2012 is estimated to annualize growing 0.3% a year, down from the 0.9% annualized for 2006-2010. To hit the 0.3% forecast precisely, 2011 and 2012 would need to grow at a 0.8% rate.
Tag Archives: forecast
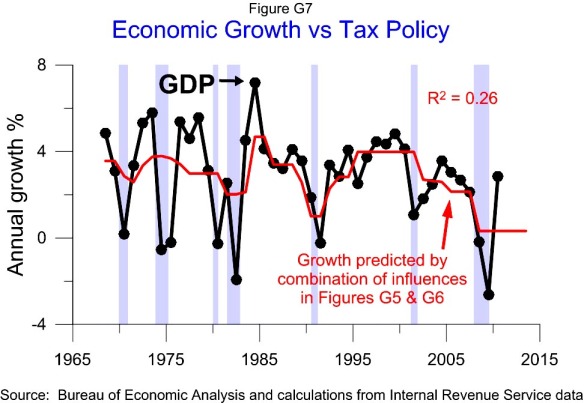
G7 Tax Policy vs GDP Growth 1968-2010
 Figure G7 shows annual growth for GDP from 1968 to 2010 and the combined influence on growth from the curvilinear relationship of the top marginal tax rate on growth shown in Figure G5 and the curvilinear relationship of the capital gains tax rate shown in Figure G6.
The curvilinear relationships of the tax rates with growth suggest the baseline growth rate for current tax policy is 0.3%. This is weaker than the forecast of the linear correlations shown in Figure G3.
Figure G8 shows the actual growth over 5 year periods and the 5 year rate of growth estimated by the above model.
To show the influence of tax policy on growth prior to 1968 requires showing the influence of the top tax bracket on growth and how the top bracket affects the growth optimizing tax rates. These correlations are covered in Figures T2, T3 and G9 –G15.
