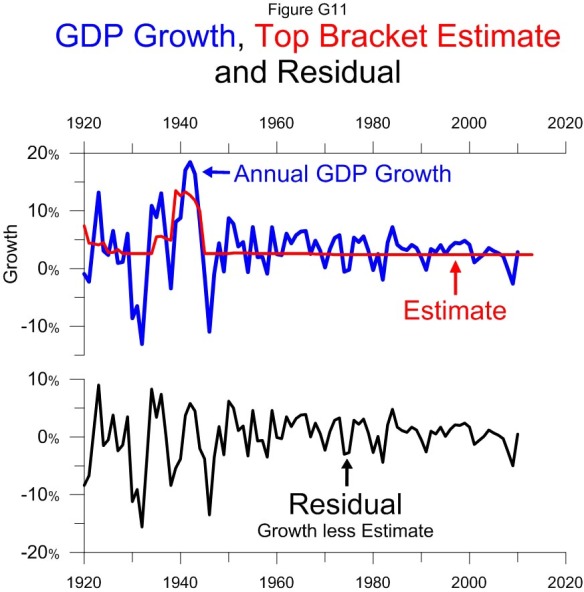
 This chart shows actual GDP growth from 1920, the growth estimated by the top bracket as shown in Figure G9 and the residual of the growth minus the estimate.
Figures G12 and G13 show the relationships of the Top tax rate and the capital gains tax rate with residual growth. Letting the tax rates estimate residual growth makes for smoother construction of the model in Figure G14 that uses the top bracket, the top rate and the capital gains rate to predict growth.
